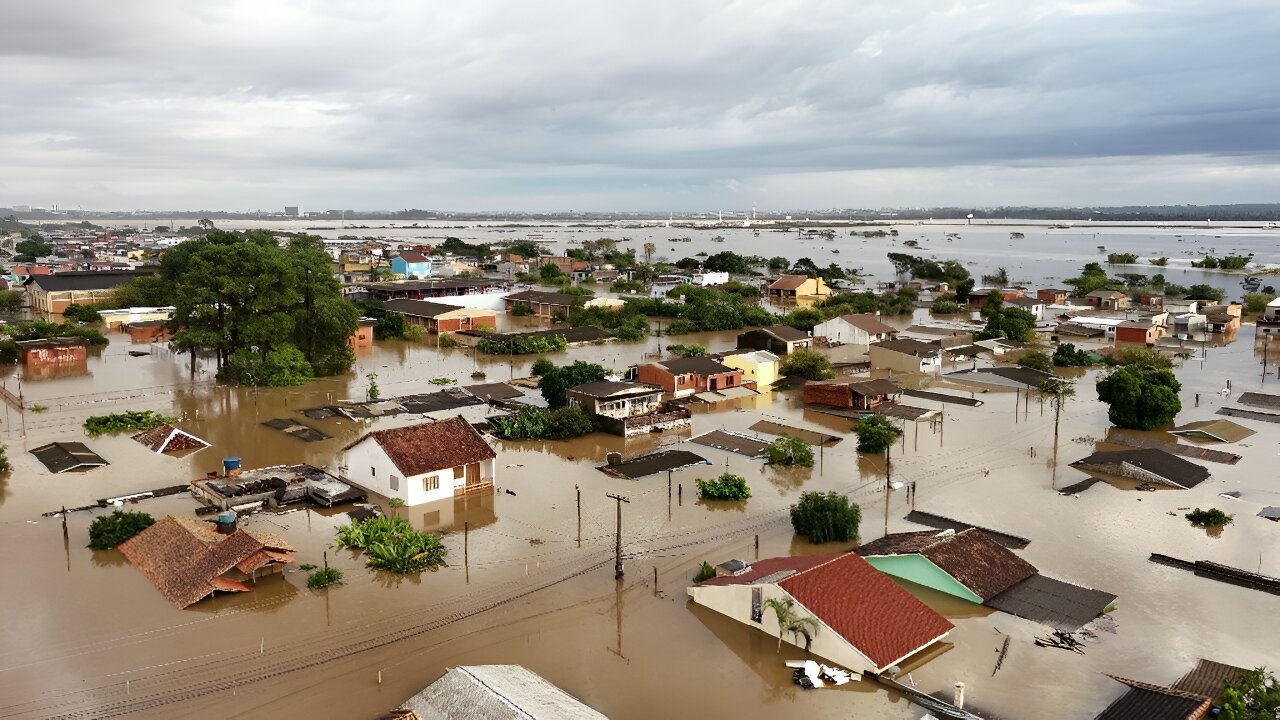
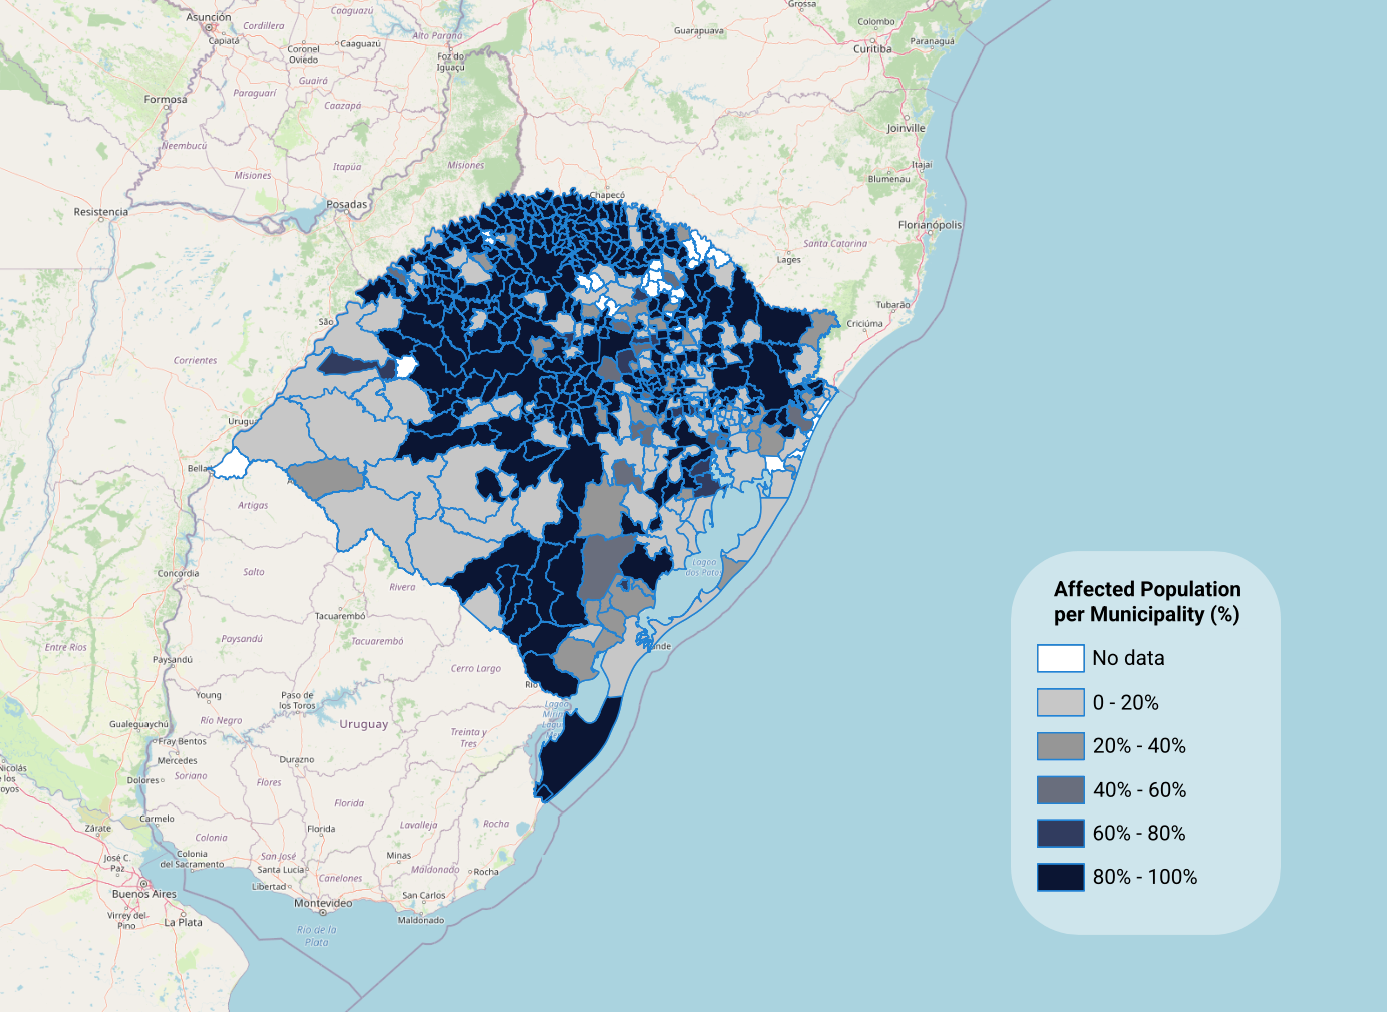
The maps below provide an overview of the situation in the municipalities of the state of Rio Grande do Sul following the floods. The data is derived from the MD1 - Affected Population dataset, normalized and georeferenced using the IBGE municipal boundaries shapefile and processed with QGIS.
The resultant geojson file was then transferred to HTML using the Leaflet library. The relative datasets (%) are based on 2024 population estimates from IBGE and therefore include its margin of error.
These comparison maps illustrate the relationship between orography (terrain elevation) and the impact of rainfall. Many urban areas are located in lower-lying terrain, where drainage systems concentrated large volumes of water during the floods.
The Event Impact (%) map is based on the MD-1 Affected Population dataset and IBGE municipal boundaries shapefile, processed using QGIS. The elevation map uses elevation data from U.S. Geological Survey (USGS) database, compiled and processed in QGIS and exported as PNG images.

The line chart below shows the monthly rainfall across Brazilian states in 2024. It highlights a remarkable anomaly in the state of Rio Grande do Sul, where rainfall levels were dramatically higher than in other states. Historically, the region experiences two main rainy seasons: April–May and August–September, typically with comparable levels of precipitation. In 2024, while September rainfall aligned with historical norms, the May rainfall more than doubled the expected volume, contributing significantly to the flood disasters.
The line chart below shows vegetation cover and deforestation trends across Rio Grande do Sul from 2004 to 2023.
The chart reveals an inverse relationship between the growth of anthropized areas (Human-Altered), largely due to agriculture, and the decline of native vegetation (Primary Vegetation).
Other forms of land use, such as areas under recovery, have remained relatively stable over time.
While the data does not reveal dramatic changes in forest cover or urban growth across municipalities in Rio Grande do Sul between 2013 and 2023, it highlights the importance of mitigation efforts. Expanding green areas within cities can improve water runoff, reduce the risk of landslides, and enhance soil stability. Additionally, considering South America's rainfall system is highly interconnected — a phenomenon known as the "flying rivers" — effective disaster prevention depends on coordinated national policies and regional cooperation. Such strategies are vital to prevent future tragedies like the devastating 2024 floods in southern Brazil.
The line chart below presents the historical trend of federal expenditures in Brazil's Civil Defense system, specifically under Action 22BO (“Protection and Civil Defense Actions”). The data shows a significant drop in investments between 2017 and 2021—not due to fewer disasters, but as a result of reduced government spending.
A moderate increase is observed in 2022, an election year, followed by a sharp rise starting in 2023. In 2024, investments spike dramatically in response to the catastrophic floods in Rio Grande do Sul. This pattern highlights how disaster response funding has been reactive rather than proactive, raising concerns about long-term resilience and preparedness.